



Most cost-per-case numbers fall apart the moment someone asks a follow-up question. A program director says the agency spends "about $1,400 per client" — and then a funder asks whether that includes supervision time, whether crisis cases cost the same as maintenance cases, or what happens if caseloads jump 20% next quarter. The number wasn't exactly wrong. It just wasn't built to answer real questions.
That's the actual problem with cost per case in social services. It's rarely a math problem — it's a modeling problem. Agencies that struggle with this aren't bad at arithmetic. They've built a single flat average that hides every operational reality underneath it. And when the model is flat, every decision built on top of it is essentially guesswork.
This piece walks through how to build a cost-per-case model that holds up under pressure: one that maps complexity to staffing, ties directly to funder deliverables, and survives a sensitivity check when conditions change. Not a perfect model. A useful one.
Why the flat average quietly breaks everything
The pattern is pretty consistent: an agency takes its total program budget, divides it by cases served, and calls that the cost per case. Clean. Reportable. Completely misleading.
Casework isn't uniform. A stable client on a monthly check-in consumes maybe 45 minutes of direct time a month. A high-acuity client in the middle of a housing crisis can eat six or seven hours in a single week — plus partner calls, documentation, supervision consults, and the kind of emotional load that slows everything else down. Average those two together and you get a number that describes nobody.
The flat average causes three predictable failures:
-
You underprice complex programs. When a funder asks you to take on a harder population, you quote your blended average and lose money on every case.
-
You can't defend your staffing. If someone challenges your caseload ratios, "we spend $1,400 a case" tells them nothing about why you need the staff you have.
-
You can't forecast. When referrals shift toward higher-acuity cases — which they always do during economic strain — your budget breaks and you don't see it coming.
The deeper issue is that the flat average disconnects your finances from your operations. Cost lives in a spreadsheet, caseload lives in your case management system, and the two never talk. A model that actually works has to rebuild that connection.
Start with time, not money
The single most useful thing you can do is stop starting with dollars. Start with time.
Eliminate case management chaos.
TryCasi helps you organize, monitor, and report on every case efficiently and securely.
- Centralized case tracking
- Automated client notifications
- Team task coordination
No credit card required
Cost-per-case is really cost-per-hour-of-work-a-case-requires, wrapped in overhead. Once you think about it that way, the model gets a lot more honest. So the first step is figuring out how many hours different kinds of cases actually consume — direct and indirect.
In practice, this usually means running a rough time study. You don't need a research-grade methodology. Two or three weeks where a handful of caseworkers tag their time against case types is enough. Even messy data beats guessing. What comes out is almost always surprising to leadership — indirect time (documentation, coordination, travel, no-show follow-up) frequently runs 40–60% of total case time, and it's the part that never shows up in program design.
A typical breakdown might look like this:
| Case tier | Avg direct hrs/month | Indirect hrs/month | Total hrs/month |
|---|---|---|---|
| Tier 1 — Stable/maintenance | 0.75 | 0.5 | ~1.25 |
| Tier 2 — Active/moderate | 2.5 | 2.0 | ~4.5 |
| Tier 3 — Crisis/high-acuity | 6.0 | 4.0 | ~10 |
Notice the range. A Tier 3 case isn't twice a Tier 1 — it's closer to eight times the workload. Any model that ignores that will misallocate staff and misprice contracts. Complexity isn't linear, and budgets built on averages assume it is. That's the core insight most agencies miss.
Turning hours into a real cost per case
Once you have hours per tier, the money part is fairly straightforward. You need a fully-loaded hourly cost for your caseworkers — salary plus benefits, taxes, and a fair share of overhead (rent, software, admin, supervision, insurance).
A simple way to get the loaded rate: take the total annual cost of employing a caseworker and divide by their actual casework-available hours, not their paid hours. This trips people up constantly. A full-time caseworker is paid for roughly 2,080 hours a year, but between PTO, training, meetings, and administrative overhead, the hours actually available for casework are often closer to 1,300–1,500. Dividing by 2,080 understates your true cost per hour by a wide margin — sometimes 30% or more.
-
Calculate the fully-loaded annual cost per caseworker role (salary + benefits + allocated overhead).
-
Divide by realistic casework-available hours to get a true loaded hourly rate.
-
Multiply that rate by total monthly hours per tier to get a monthly cost per case by tier.
-
Weight by your actual case mix (what % of your caseload sits in each tier) to get a blended cost that reflects reality.
-
Add program-level costs that don't scale per case — management, evaluation, non-billable coordination — as a separate layer.
That last step matters. Keep per-case costs and fixed program costs in separate buckets. When you smear fixed costs across cases, your per-case number swings wildly with volume and you lose the ability to explain what's actually driving it.
Below is a visual that outlines this calculation process.
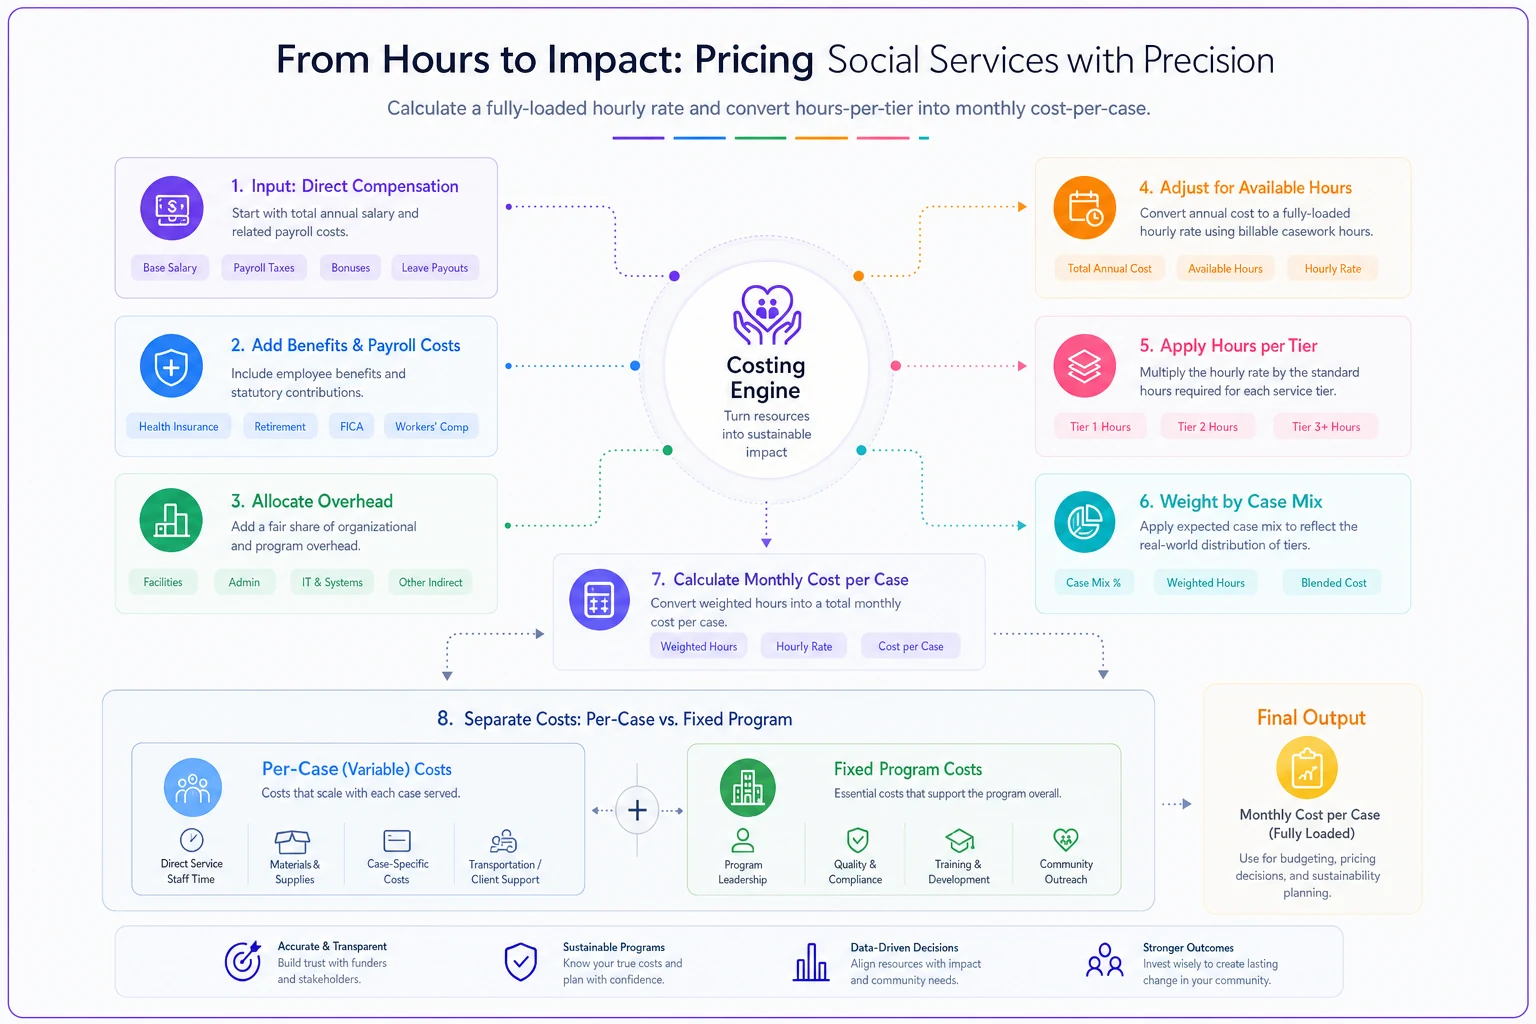
The process ties hours to dollars in a way that surfaces the operational levers: available hours, tier hours, and case mix.
Connecting the model to funder deliverables
A cost model that only lives in finance is half a model. The other half is the funder relationship — because most agencies aren't funded to serve "cases," they're funded to deliver specific things: assessments completed, plans developed, contacts made, outcomes achieved.
The trick is mapping your tiers and hours to the deliverables in your contracts. If a funder pays per completed assessment but your Tier 3 cases require three times the assessment effort of Tier 2, your flat reimbursement rate is quietly subsidizing the funder on your hardest cases. You need to see that clearly before you sign, not after.
This is where the cost model becomes a negotiation tool. When you can show a funder — with numbers pulled from your own operations — that the population they want served skews toward Tier 3, you can have a real conversation about rates or caseload caps instead of just absorbing the gap. This connects directly to the broader work of building an operating model that aligns casework, funding and compliance, where the cost model becomes one input into a larger system rather than a standalone spreadsheet.
A short funder-facing version of the model should include:
-
Your case tier definitions and what moves a case into each tier
-
Cost per case by tier, with the loaded-rate methodology briefly explained
-
Your current case mix and how it maps to their deliverables
-
What a shift in that mix would do to cost
Keep it to two pages. Funders don't want your full spreadsheet — they want to trust that one exists behind the summary.
The part everyone skips: sensitivity scenarios
A static cost-per-case number is a snapshot of a moment that's already gone. The real value shows up when you can answer "what if."
Sensitivity scenarios are just versions of your model with a few key variables changed. The three that matter most in casework:
-
Case mix shift. What happens to blended cost if Tier 3 grows from 15% to 25% of your caseload? Usually a much bigger jump than leadership expects, because Tier 3 hours dominate.
-
Caseload size changes. If you add 30 cases without adding staff, your per-case cost drops on paper — but quality and retention costs rise in ways the number won't show. Model both.
-
Staffing cost changes. A cost-of-living raise, a turnover spike, or a shift toward more experienced staff all move your loaded rate.
The point isn't precision. Nobody knows exactly what next year looks like. The point is knowing which lever moves your budget most so you're not surprised when it does. In practice, case mix is almost always the biggest lever, and it's the one agencies track least.
Sensitivity work also connects to staffing decisions in a way that's easy to overlook. Caseload ratios and cost per case are really the same conversation from two directions. If your model shows Tier 3 cases consuming 10 hours a month, that directly constrains how many cases one worker can carry. This is where the cost model and your career ladders and caseload rules with a retention ROI model reinforce each other. Overload a worker to hit a per-case cost target and you'll pay it back in turnover — which quietly wrecks the very number you were trying to optimize.
A real scenario
A mid-sized housing case management program — around 240 active clients, seven caseworkers — was reporting a flat cost of roughly $1,250 per case to its main funder. When they broke the caseload into tiers, the picture changed.
Their case mix was about 20% Tier 3, 55% Tier 2, and 25% Tier 1. Once they applied realistic hours and corrected their loaded rate (they'd been dividing by paid hours, not available hours), the tiered costs came out roughly:
-
Tier 1
~$180/month per case
-
Tier 2
~$520/month per case
-
Tier 3
~$1,150/month per case
The blended number was actually higher than they'd reported — closer to $1,500 when overhead was allocated honestly. More importantly, they could now see that Tier 3 cases were consuming a wildly disproportionate share of the budget. When a funder proposed expanding intake toward higher-acuity referrals, the program went back with a specific ask: either a higher rate for that population or a hard cap on Tier 3 volume per worker. They got a modest rate bump on complex cases and avoided taking on roughly a dozen cases they couldn't have staffed. Not a dramatic turnaround — just a decision made with eyes open.
Where spreadsheets stop working
A spreadsheet-first model is the right place to start. It forces you to understand the math instead of trusting a black box, and it's easy to hand to a funder. For a lot of small programs, a well-built spreadsheet is genuinely all you need.
But the model is only as current as the last time someone updated it. Case mix drifts. New staff come in at different rates. Referral patterns shift. When your tiers and hours live in a spreadsheet and your actual case data lives in your case management system, keeping the two in sync becomes a manual chore that slowly stops happening. The model that was accurate in January quietly becomes fiction by June.
This is where pulling tier tags, contact time, and caseload counts directly from an operational platform starts to matter — not to replace your judgment, but to keep the inputs honest without someone re-typing them every month. AI-assisted tagging can flag when a case is drifting up a tier based on activity patterns, so your cost model reflects what's actually happening rather than what someone remembered to reclassify. The math stays yours. The bookkeeping around it just stops eating your time.
When to keep it simple
If you run a small program with fairly uniform cases and one main funder, don't overbuild this. A three-tier spreadsheet you actually maintain beats a sophisticated model nobody updates. The failure mode for small agencies isn't lack of complexity — it's building something too elaborate to keep alive.
For small programs, prioritize a maintained three-tier spreadsheet over building an elaborate automated system you can't keep current.
Layer in tighter tracking when you've got multiple funders with different deliverables, a case mix that shifts noticeably through the year, or when you're negotiating a new contract and need to defend your numbers. That's when the connection between live operational data and your cost model earns its keep.
Pulling it together
A cost-per-case model isn't a reporting formality — it's the thread that connects your caseload reality to your staffing, your contracts, and your ability to say yes or no to new work with some confidence. The flat average feels efficient, but it hides exactly the information you need most: how much your hardest cases actually cost, and what happens when your mix shifts.
Build it from time, not dollars. Separate per-case from fixed costs. Map it to what your funders actually pay for. Run a few sensitivity scenarios so you're not blindsided. And keep it simple enough that it stays alive month to month. A model that's slightly rough but current will always beat a precise one that's six months out of date.
A cost-per-case model isn't a reporting formality — it's the thread that connects your caseload reality to your staffing, your contracts, and your ability to say yes or no to new work with some confidence. The flat average feels efficient, but it hides exactly the information you need most: how much your hardest cases actually cost, and what happens when your mix shifts.
Build it from time, not dollars. Separate per-case from fixed costs. Map it to what your funders actually pay for. Run a few sensitivity scenarios so you're not blindsided. And keep it simple enough that it stays alive month to month. A model that's slightly rough but current will always beat a precise one that's six months out of date.
Ready to transform your social services workflow?
Join 500+ agencies using TryCasi to improve case outcomes, enhance collaboration, and reduce administrative burden.